本帖最后由 tfsn20 于 2023-9-9 15:08 编辑
本帖最后由 tfsn20 于 2023-3-15 13:01 编辑
文献搜索与下载:
科研通:https://www.ablesci.com/,
一般求助后半分钟出结果(反正就是最强的一个),配合我的脚本https://scriptcat.org/script-show-page/870,
每日自动签到,一天10积分,求助一篇大概10积分。它本身的搜索是精准搜索,我建议使用bing的site站点搜索,即使搜索标题(doi也是可以的)不完全复合也可以,具体这样搜索
不过我都是集成到搜索引擎中,省的每次多打字:https://cn.bing.com/search?q=site%3Aablesci.com+%s
怎们根据已有信息搜索文献:
我导师给我发来这样的信息,让我下载文献
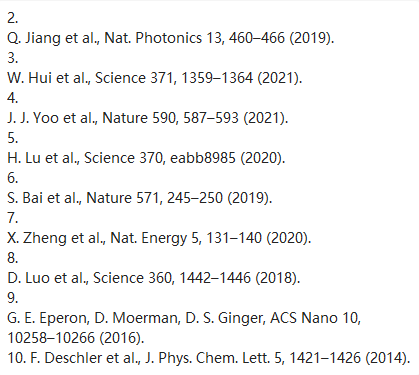
可以直接谷歌(可以使用https://sc.panda321.com/scholar?hl=zh-CN&q=%s 代替,免翻墙),比如搜索Q. Jiang et al., Nat. Photonics 13, 460–466 (2019)
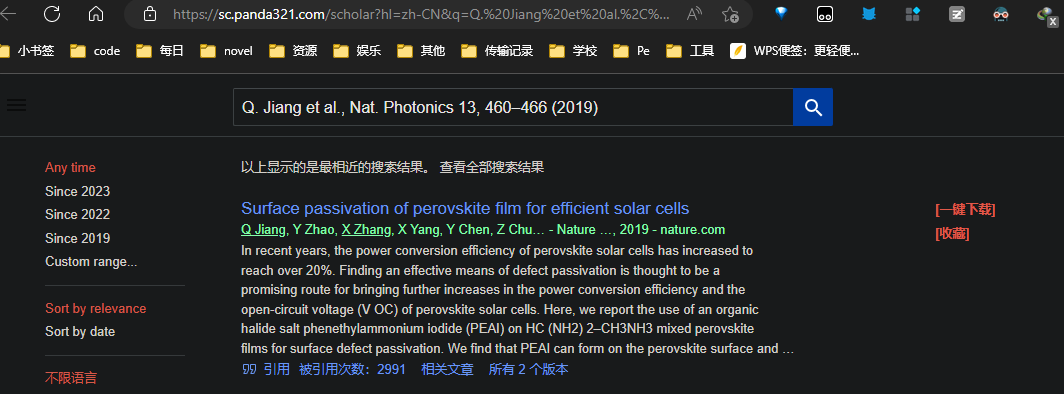
应该没错了,点进去
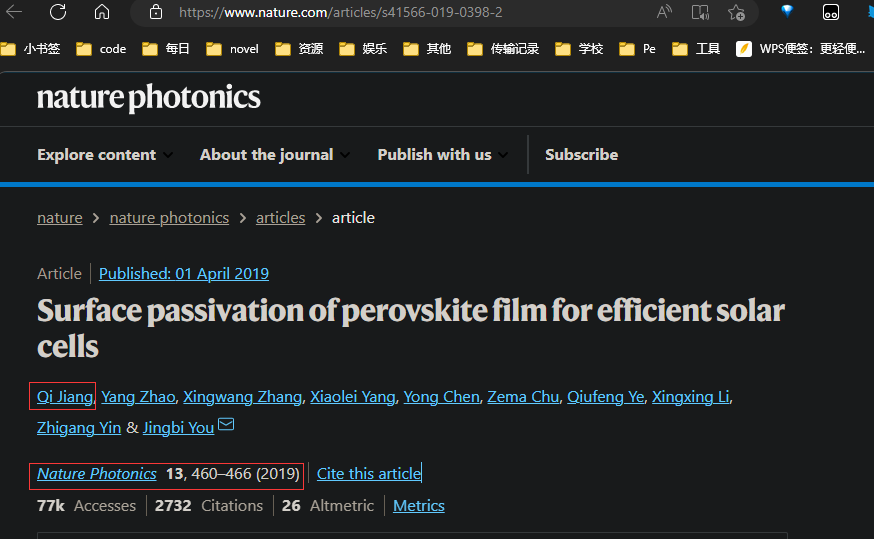
这两处对应Q. Jiang(第一作者,et al.是等人的意思)和Nat. Photonics 13, 460–466 (2019),接下来可以复制doi或标题进行下一步搜索。doi在哪?——其实网站中的s41566-019-0398-2差不多就是加上每个出版社固定的前缀,这篇就是10.1038/s41566-019-0398-2
画图
originPro:微信文章上有pojie版,前几天我刚下载,能用(百度网盘真慢啊,脚本,解析站好像都凉了)。我用的是2022版,对pyhton的支持进行了更新。
学姐给我发来了这样的表格数据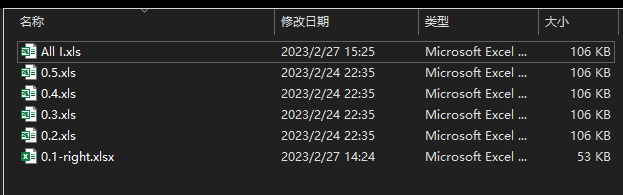
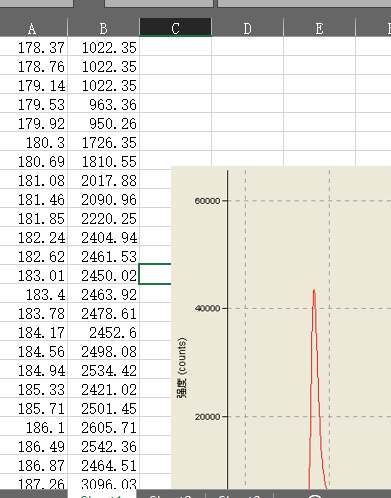
要把数据画到一张图上做对比。复制粘贴固然可以(但是以后要做无数张这样的),可以借助originPro内置的python,上代码
import originpro as op
import os
print('start working......\nif end, will show end\n') #开始执行代码
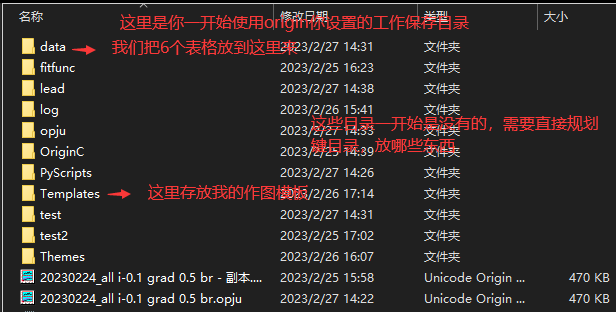
content='data' # your data(cvs namely excel, txt, dat...) should in the content
x_lname='wavelength'
y_lname='intensity'
x_unit='nm'
y_unit='counts'
path = op.path('u') + content # work sup dir
wks_temp = op.new_sheet("w",'Book2')
wks = op.find_sheet(ref='Book1') #active Book1
for i,file in enumerate(os.listdir(path)): # file is file name
fullpath = os.path.join(path, file) # get fullpath
wks_temp.from_file(fullpath) # frome file lead data
#print(i)
wks.from_list(i*2, data = wks_temp.to_list(0),axis='X',comments=file,lname=x_lname,units=x_unit)
wks.from_list(i*2+1, data = wks_temp.to_list(1),comments=file,lname=y_lname,units=y_unit)
op.wait() # wait until operation is done
op.wait('s', 0.05)
print('end')
大概意思是从data目录里变历文件,将数据放入Book1中(其实有好多细节和坑),代码不涉及作图部分,选中你要的数据部分,用模板一键完成制图。
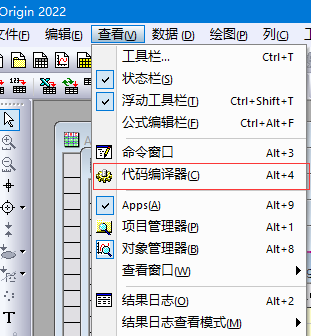
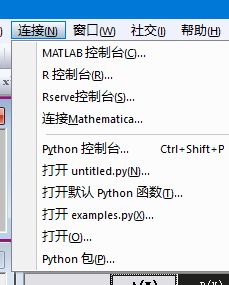
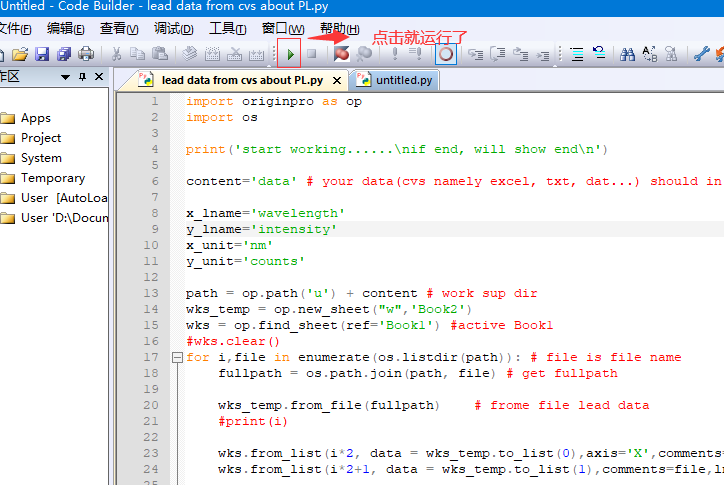
怎样运行代码
打开originPro,会自动生成一个工作簿,不用动,
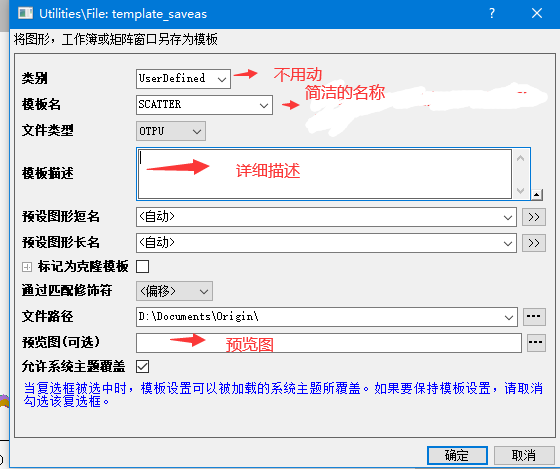
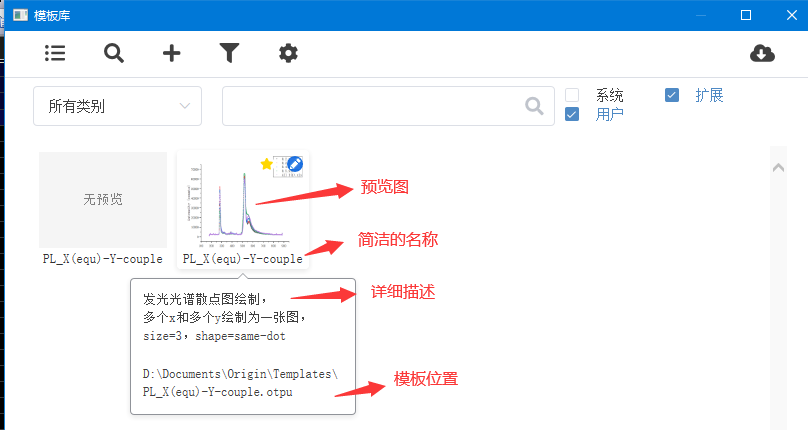
关于模板
第一次作图需要自己做,然后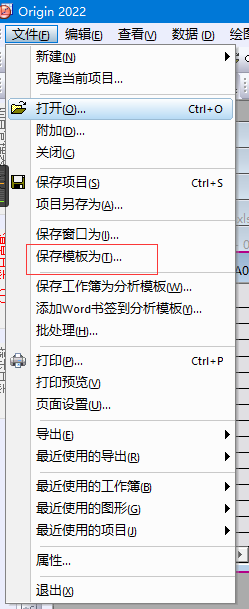
效果
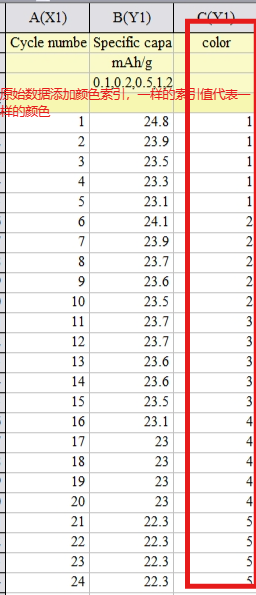
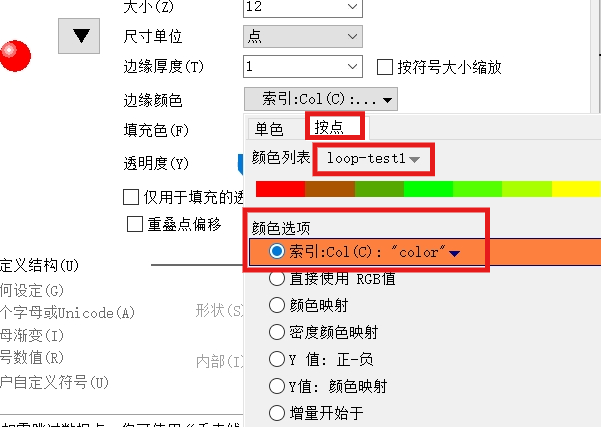
originlab 散点图改变每5个点的颜色
参考


 置顶卡
置顶卡 沉默卡
沉默卡 照妖镜
照妖镜


